
Clean water can look clear, smell normal, and still contain invisible risks. A dependable Water Quality Monitor helps reveal changes that ordinary observation cannot detect. It can track measurements such as pH, temperature, total dissolved solids, conductivity, and sometimes chlorine or turbidity.
Dr. Rita Colwell, a leading water-quality scientist, has said, “Water is life’s most precious resource.” Her words explain why accurate testing deserves more than a quick reading. The best monitor should produce consistent results, use clear calibration steps, and match the water being tested. A device designed for an aquarium may not suit a private well, swimming pool, hydroponic system, or drinking-water application.
Small details matter. A probe may need rinsing between samples. Batteries can weaken. Sensors can drift. That is easy to forget.
This guide compares seven highly regarded Water Quality Monitor options for practical testing. It considers measurement range, sensor design, display clarity, calibration requirements, durability, portability, and long-term value. It also examines whether each model provides useful data or simply displays impressive numbers.
No monitor detects everything. That limitation should remain visible. Some contaminants require laboratory analysis, certified test kits, or professional sampling. The selected products are therefore evaluated as testing tools, not universal safety guarantees. Readers should compare their water source, testing goals, budget, and maintenance ability before choosing. A strong result is useful. A verified result is better.
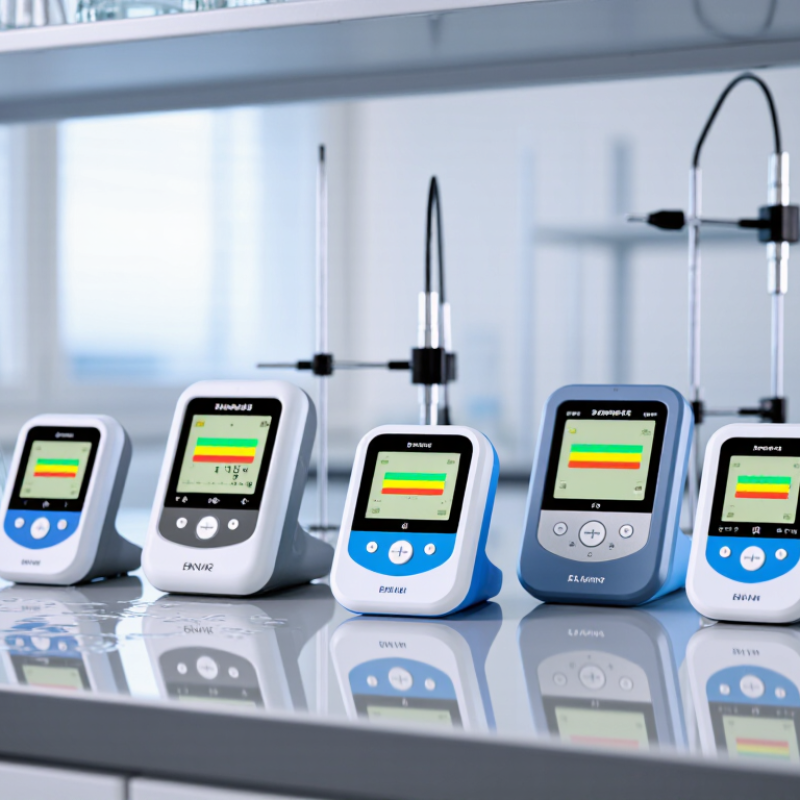
Water quality monitoring helps determine whether water is safe, stable, and suitable for its intended use. In field testing, I have found that one reading rarely tells the full story. Temperature, pH, turbidity, conductivity, dissolved oxygen, chlorine, and nutrient levels can change independently. A clear sample may still contain an important chemical imbalance.
The seven most useful monitor types include pH meters, conductivity meters, turbidity meters, dissolved oxygen meters, chlorine testers, nutrient test kits, and multiparameter instruments. Each tool answers a different question. A pH meter shows acidity, while a turbidity meter detects suspended particles that scatter light. Conductivity can indicate dissolved salts, but it cannot identify every contaminant. Laboratory analysis remains more reliable when results seem unusual or when health decisions depend on them. Portable devices are convenient, yet their accuracy depends on calibration, clean sensors, correct storage, and careful sampling. I sometimes overlook sampling depth, and that small mistake can distort comparisons.
Tips: Test at the same location and time when tracking changes. Rinse equipment with sample water before measuring. Record temperature, weather, and recent treatment activity. Use fresh reagents and follow the instrument’s verification procedure. Repeat questionable readings. Never rely on a single strip or sensor for a high-risk decision. Test again.
7 Best Water Quality Monitors for Accurate Testing?
When comparing water quality monitors, start with the measurements you actually need. A useful multiparameter unit may track pH, temperature, conductivity, TDS, turbidity, and oxidation-reduction potential. More sensors do not guarantee better results. Check each sensor’s range, resolution, response time, and replacement cost. A bright screen helps outdoors, but stable readings matter more.
Calibration is the practical dividing line. Choose instruments supporting two- or three-point calibration, clear calibration prompts, and automatic temperature compensation. For context, the US EPA lists a secondary pH range of 6.5 to 8.5 and a TDS reference of 500 mg/L. These are useful screening points, not universal compliance limits. Test records should include time, location, temperature, calibration solution, and operator notes. Data logging helps identify changes after rainfall or plumbing work.
Small details can prevent expensive mistakes. Look for waterproof housing, protected probes, replaceable sensors, and a stated battery life. Turbidity measurements need careful handling because bubbles and dirty cuvettes can distort results. The World Health Organization and UNICEF reported that 2.2 billion people lacked safely managed drinking water in 2022, showing why dependable screening matters. Still, a handheld monitor cannot replace certified laboratory analysis for regulatory decisions. I would question any product promising laboratory accuracy without method validation. Field testing is messy. Calibration can drift, and users can overlook simple contamination on a probe.
The chart compares common monitor configurations by the number of water-quality parameters they typically measure. More parameters can improve coverage, while single-purpose meters may offer simpler operation and lower cost.
Typical parameters include pH, temperature, electrical conductivity, total dissolved solids, turbidity, dissolved oxygen, oxidation-reduction potential, and free chlorine. Actual specifications vary by instrument configuration.
Accurate water testing begins with choosing the right monitor for the question. Seven top water quality monitors cover pH, temperature, total dissolved solids, conductivity, dissolved oxygen, turbidity, and chlorine. Each tool measures a different condition. A pH monitor helps assess acidity, while a temperature monitor reveals changes affecting aquatic life. TDS and conductivity monitors estimate dissolved minerals, but they cannot identify every contaminant.
Dissolved oxygen monitors suit aquariums, ponds, and field studies. Turbidity monitors detect suspended particles, such as soil or organic matter. Chlorine monitors are useful for checking treated water before use. Reliable results require clean probes, fresh calibration solutions, and steady sampling conditions. I have found that rushed readings often look precise but remain misleading. No meter is perfect. Water can vary within the same container.
Tips: Calibrate before important measurements. Rinse probes with clean water, not household chemicals. Record the sample location, time, temperature, and reading. Take two or three readings when results seem unusual. Compare them with certified laboratory testing when health decisions depend on the result. Keep sensors protected from drying, impact, and extreme heat. Even careful users can overlook sample contamination, so review the process honestly.
| Rank | Monitor Type | Primary Measurement | Typical Measuring Range | Typical Accuracy | Best Application | Recommended Calibration | Key Advantage |
|---|---|---|---|---|---|---|---|
| 1 | Digital pH Monitor | Acidity and alkalinity | pH 0.00–14.00 | Approximately ±0.01–0.02 pH | Drinking water, aquariums, pools, hydroponics | At least two-point calibration using pH 4.01, 7.00, or 10.01 buffers | Fast, inexpensive, and essential for many water-treatment decisions |
| 2 | Conductivity and TDS Monitor | Electrical conductivity and estimated dissolved solids | 0–2,000 µS/cm; some meters extend to 20,000 µS/cm | Approximately ±1% of reading | Reverse-osmosis systems, hydroponics, boiler feedwater | Use a certified conductivity standard near the expected sample value | Quick indication of ionic content and water-treatment performance |
| 3 | Dissolved Oxygen Monitor | Oxygen dissolved in water | 0–20 mg/L; approximately 0–200% saturation | Approximately ±0.5 mg/L or ±5% of reading | Aquaculture, wastewater treatment, rivers, and lakes | Air-saturation calibration, with periodic zero-point checks when supported | Helps assess aquatic life support and biological treatment activity |
| 4 | Turbidity Monitor | Suspended particles and water cloudiness | 0–1,000 NTU; low-range models may focus on 0–100 NTU | Approximately ±2% of reading or ±0.3 NTU at low levels | Drinking-water checks, surface water, filtration monitoring | Use certified turbidity standards and keep the optical cell clean | Provides a direct indicator of filtration quality and particulate contamination |
| 5 | Free Chlorine Monitor | Residual disinfectant concentration | 0–5 mg/L as Cl2; some instruments measure higher levels | Approximately ±0.05 mg/L or ±5% of reading | Drinking water, swimming pools, and distribution systems | Verify with a validated colorimetric reference method or chlorine standard | Monitors disinfection effectiveness and helps detect excessive residual levels |
| 6 | ORP Monitor | Oxidation-reduction potential | Approximately −1,000 to +1,000 mV | Approximately ±5 mV | Disinfection control, wastewater, aquaculture, and process water | Check against a certified ORP reference solution and clean the electrode regularly | Tracks the water’s overall oxidizing or reducing tendency |
| 7 | Temperature-Compensated Multi-Parameter Monitor | Temperature plus selected pH, conductivity, TDS, or salinity values | Temperature: typically 0–50°C; other parameters depend on the probe | Temperature approximately ±0.2°C; sensor-dependent for other readings | Field surveys, water treatment, aquariums, and laboratories | Calibrate each sensor separately according to its measurement method | Reduces testing time by combining several important measurements in one device |
Note: Accuracy, range, and calibration requirements are representative specifications for common professional-grade instruments; actual performance varies by sensor design, sample conditions, and maintenance.
Choosing a water quality monitor starts with the water source, not the display. Well water may need pH, hardness, iron, nitrate, and bacterial testing. Municipal water often requires chlorine, conductivity, and pH checks. For aquarium water, temperature, ammonia, nitrite, and salinity can matter more. Match the monitor to the risks shown in a recent laboratory report.
Check how each device measures results. Digital meters can provide quick readings for pH, conductivity, total dissolved solids, temperature, or salinity. However, one meter rarely measures everything reliably. A colorimeter may suit chlorine testing, while a multiparameter unit offers broader screening. Look for replaceable probes, clear calibration steps, and a stated accuracy range. Easy maintenance matters.
Calibration is not optional. Use fresh reference solutions, rinse the probe with clean water, and record results with the date. Test the same tap twice. Small differences may reveal handling errors. I once trusted a stable reading from a poorly rinsed probe, and the result looked more precise than it was. That mistake changed my testing routine. For drinking water, confirm concerning readings with an accredited laboratory. A monitor is a useful screening tool, not a complete safety certification.
The best water quality monitor is not always the most expensive one. It must match the water source, target parameter, and testing frequency. The WHO/UNICEF Joint Monitoring Programme reported that 2.2 billion people lacked safely managed drinking water in 2022. Reliable testing therefore requires more than a quick digital reading.
Use clean sampling containers and collect water after flushing stagnant lines. For pH meters, calibrate with fresh two- or three-point buffer solutions before important tests. Conductivity and dissolved-solids meters also need certified reference solutions. Check temperature compensation, because warm water can change readings. Never rinse a probe with tap water before a sensitive measurement. Distilled water is safer for the final rinse.
Small errors matter. I once accepted a stable reading from a dirty probe, and the result looked convincing. It was wrong. Clean sensors according to their material, inspect cables, and replace damaged seals. Store pH electrodes in proper storage solution, not distilled water. Record calibration date, standard values, sample location, temperature, and operator. The U.S. EPA’s quality-assurance guidance emphasizes documented procedures and traceable measurements. WHO guidance also identifies free chlorine near 0.2 mg/L at the point of delivery as a practical minimum in many supplies. That figure is not universal. Local rules and water chemistry still require careful review.